Forum Migration Notice
Update (2026-01-21): The user forums are now in read-only mode pending the data migration.
Update (2026-01-12): The user forums will be put into read-only mode on the 21st of January, 00:00 CET, to prepare for the data migration.
We're transitioning to a more modern community platform by beginning of next year. Learn about the upcoming changes and what to expect.
Update (2026-01-12): The user forums will be put into read-only mode on the 21st of January, 00:00 CET, to prepare for the data migration.
We're transitioning to a more modern community platform by beginning of next year. Learn about the upcoming changes and what to expect.
Plot robotarget in simulation

in RobotStudio
Hi,
I want to know if it is possible to plot in the simulation robotarget coordinates (X, Y, Z). I don't want to plot the TCP trace, but TCP points yes.
In my RAPID program I generate n targets from external application with a dataset. I need to plot the TCP coordinates (points) from dataset.
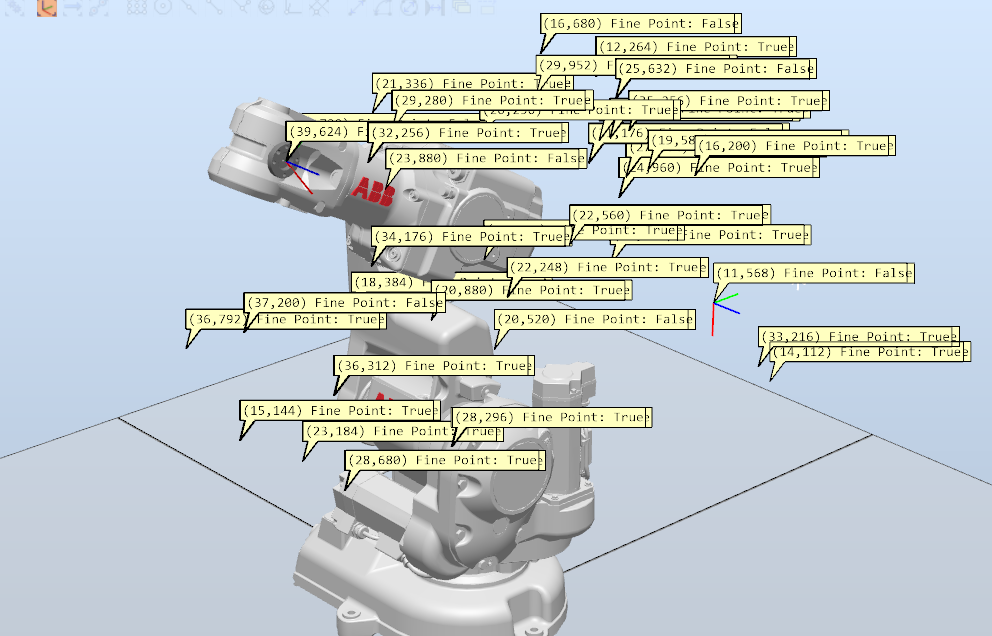
From my low knowledge in Robotstudio, I only could plot event, but it is not suitable for a figure (see attachment).


What could I do?
Best regards.
Tagged:
0
Comments
-
Hi,
No one knows how is possible to plot robotarget?
I will ask you in other way:
If I have a list of target (XYZ) to be simulated in Robotstudio, Could I import those targets to convert into robtarget from Robotstudio? or Do I need to create manually all targets (230 points)?
Best regards.0 -
There is a point cloud import Addin - on the Add-ins tab search for it in the gallery.
0 -
Hi,I installed the Point Cloud Import App in RobotStudio, but I couldn't import any supported cloud pints.Do you have more information about it?I have this format in a file (XYZ):342.593 86.955 530.807345.793 34.477 534.007....I appreciate if you can tell me about the suitable file format (e.g. *.xyz), the structure of the XYZ points for a right imported file...Regards.0
-
It has been two or three years since I messed with some point importing, not even sure which add in. I got it to work by making a simple excel .csv file with the xyz coords.Lee Justice0
-
Aside from an add in I imagine you could do it with programming in RAPID or any object oriented type programming language (Macro in excel would work).
Read your x,y,z in from a CSV and then build a rob target position data.
You should be able to equal robtarget to a value using instruction "robtarget.trans.x""robtarget.trans.y""robtarget.trans.z" etc.
p230.trans.x:=342.593;
p230.trans.y:=86.955;
p230.trans.z:=530.807;
If I had to do this quickly I would copy paste in the 230 generic targets numbered 001 to 230.
Then equal the x y and z data to the list that you already have generated.
Generate the list in excel convert to a csv that looks similar in format to whats above open in notepad copy and paste into Rapid text edit using find/replace if necessary.
Just as a word of warning these may not work for any type of motion path as the configuration and quaternians may not be correct.
0 -
The addin states:-"Supports the following file types: .pts (Leica Point Cloud) .xyz (XYZ pos, RGB color) .bin (Size, X, Y , Z)"
So you may need to add three trailing 0 fields for each point for the RGB in the .xyz format.
Or one leading feild for size in .bin format.
.pts format is number of points X Y Z Intensity value R G B
example
342684 (= number of points)
4.246445 -6.426620 -50.214615 -399 66 50 83 (= X Y Z intensity R G
-9.318283 -6.014053 -51.129257 -437 132 141 152
etc0 -
Hi,
Here are two examples of syntax that works with the 'PointCloud Add-In'. The three (four in the pts-file) last values on each line is color information, and is not mandatory.
.XYZ:-5.03880000 -7.09270000 -0.00000000 148 121 66-5.03470000 -7.09210000 -0.00030000 153 123 71-5.03020000 -7.09220000 -0.00030000 150 120 69-5.02510000 -7.09270000 -0.00020000 146 117 69-5.02030000 -7.09260000 -0.00030000 150 120 65-5.01580000 -7.09200000 -0.00070000 153 121 65-5.01110000 -7.09250000 -0.00050000 149 114 64-5.00640000 -7.09190000 -0.00090000 143 111 56-5.00160000 -7.09260000 -0.00060000 141 111 55-4.99680000 -7.09150000 -0.00120000 142 110 56-4.99230000 -7.08860000 -0.00250000 140 107 54-4.98780000 -7.08960000 -0.00220000 132 103 52-4.96400000 -7.08750000 -0.00910000 142 109 56-4.96900000 -7.08990000 -0.00790000 138 105 53-4.94540000 -7.08930000 -0.00880000 139 108 58-4.95500000 -7.09200000 -0.00740000 145 111 60-4.95930000 -7.09040000 -0.00790000 139 108 54
.PTS:-526.700974 206.879959 99.716566 -1195 117 119 132-534.071884 207.782059 99.996443 -1312 21 21 23-534.277878 199.511124 99.622267 -1190 67 56 86-534.173630 199.383926 99.681868 -1208 54 58 70-532.960526 197.989334 99.510237 -1367 251 250 254-533.749222 197.998154 99.518599 -1249 255 254 255-533.506973 197.998032 99.515913 -1330 254 255 255-533.963852 197.984787 99.525770 -1267 255 254 255-533.980728 197.981827 99.526869 -1144 255 254 255-533.782852 197.991165 99.520094 -1311 255 254 255-533.530197 197.998764 99.514754 -1332 255 255 255-533.452194 197.994919 99.514570 -1358 254 253 255-533.397781 197.985886 99.515883 -1373 253 252 250
Regards,
AndersBest regards,
Anders Spaak
ABB Robotics0 -
I was sitting here going RGB? Why? Then it dawned on me it is for the point color, yes?Lee Justice0
-
Correct, it is for the point color.Best regards,
Anders Spaak
ABB Robotics0
Categories
- All Categories
- 5.7K RobotStudio
- 402 UpFeed
- 21 Tutorials
- 16 RobotApps
- 307 PowerPacs
- 407 RobotStudio S4
- 1.8K Developer Tools
- 251 ScreenMaker
- 2.9K Robot Controller
- 368 IRC5
- 92 OmniCore
- 8 RCS (Realistic Controller Simulation)
- 859 RAPID Programming
- 43 AppStudio
- 4 RobotStudio AR Viewer
- 19 Wizard Easy Programming
- 111 Collaborative Robots
- 5 Job listings

